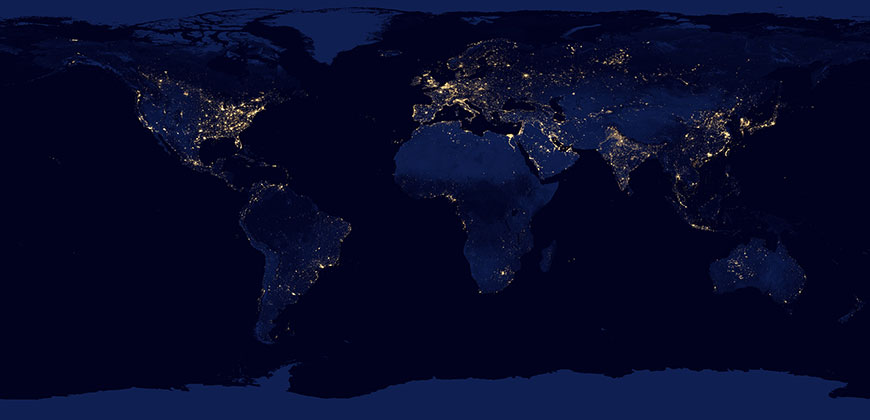
A view of Earth’s artificial light. Credit: NASA Earth Observatory
Our modern world is flooded with light – from sports stadiums, to city streetlights. Besides obscuring natural dark skies and irking astronomers, too much artificial light can disrupt sensitive ecosystems, and possibly human health.
Roger Culver, professor of physics and longtime astronomy instructor at CSU, with Eric Craine of Tucson’s STEM Laboratory Inc., and Brian Craine of Western Research Co., have created a first-of-its-kind index that ranks communities according to their observed lighting efficiency, which affects the quality of their dark skies. A paper describing their work is titled “An Approach to Objectively Defining and Ranking Dark Night Communities,” and was presented June 13 at the annual meeting of the American Astronomical Society, in San Diego. Eric Craine is an affiliate faculty member at CSU.
The Light at Night Index
Their new tool, called the Light at Night Index (LANI), assigns a numerical value to more than 19,000 individual communities in the U.S. It ranks each in terms of what the researchers call lighting efficiency – how well these communities of 500 people or more use artificial light, versus how much is wasted and sent over the horizon. LANI data, the researchers hope, can help communities make efficient use of artificial light while minimizing disruption to dark skies.
The index, based on satellite data, augments several years of research led by brothers Brian and Eric Craine. Follow-up detailed observations of specific communities integrate data from five primary sources: a ground static survey, a ground mobile survey, an airborne survey, satellite data and spectroscopic observation. Light sources were mapped and measured over time, and from all directions.
Among the researchers’ major findings in creating the LANI: Thoughtful retrofit of older outdoor lighting can significantly move communities from poor, to much more efficient use of light. This not only improves communities’ LANI rankings, but can also save on lighting costs.
Sky brightness photometer
Culver, an astronomy instructor at CSU for nearly 50 years, leads the operation of a sky brightness photometer on the roof of CSU’s Natural and Environmental Sciences Building. It is similar to one of the methodologies used in the LANI. “We’re using this instrument to understand how light at night behaves, for example, during different phases of the moon,” Culver said. “Over the long haul, you can get a degradation of sky brightness. Fort Collins has grown over the last several years, and now we have four years of data to see if there is in fact a measurable effect.”
Some people might wish to call the LANI a light pollution index, but the researchers caution against the term. Their goal wasn’t to accuse certain communities of pollution, but rather, to offer a quantitative, science-based tool to determine best practice levels for artificial light.
“Much of the monitoring of dark skies was not being done in a quantitative way,” Eric Craine said. “There was speculation as to what was good, and what was bad. It caused quite a lot of confusion, and claims by advocacy groups. We became interested in providing objective, quantitative data for these communities.”